Seasonal forecasting – are we paying attention? And should we?
Report summarising feedback from the innovators group and farmers on seasonal climate forecasts
Peter Hayman and Bronya Cooper, SARDI Climate Applications
A root cause analysis seeks to identify underlying reasons. As shown in Figure 1, an initial observation is that seasonal climate forecasts are not widely used on EP as elsewhere, or at least farmers don’t place much weight on them. As will be discussed in this report, farmers and agronomists were very critical of the Bureau of Meteorology forecasts for a wet winter and early spring in September 2020. The level of critique suggests that more attention might be paid to forecasts than people are prepared to acknowledge.
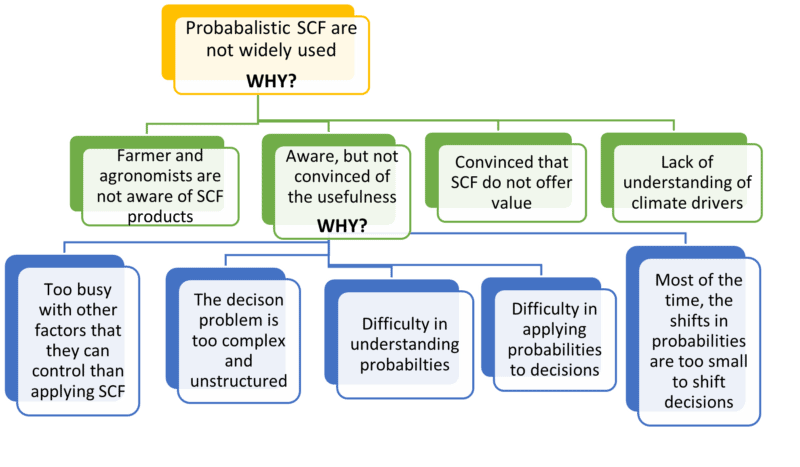
Figure 1. Simple root cause analysis for actual use of probabilistic seasonal forecasts being lower than the potential
From discussion with RIG and past experience, some of the possible reasons for forecasts not being widely used fall into broad categories (green) level. First, while it is unlikely that farmers and agronomists are unaware of forecasts, in many cases they are not aware of some of the recent developments of more time periods (weeks, fortnights, months and seasons) and the new developments in the chance of the being wetter/drier or cooler/warmer than the top or bottom two deciles. Second farmers may be aware, but not convinced of the usefulness. It is our contention that this is the largest group of farmers. There is a group of farmers and agronomists that are convinced that forecasts don’t offer value, usually because the skill of the forecast is judged as too low. This might come from experience of applying the forecast and losing money in that year. Another factor is that farmers may have a view that climate drivers such as El Nino or Indian Ocean Dipole don’t have an impact on Eyre Peninsula.
The blue level is an attempt to further investigate why farmers might be aware but not convinced of the value. Farmers and advisers are busy and there are many factors that compete for their attention. There may be a long list of other areas of the farmer’s professional and personal life with better return on effort and attention than using seasonal forecasts to manage climate risk. A second reason is that decision making on farm is just too complex and unstructured to use seasonal forecasts. The related factors of difficulties in understanding and using probabilities in decision making is clearly a barrier. Finally, it may be that the forecasts are simply judged as not offering a large enough shift in the odds.
How good are the forecasts?
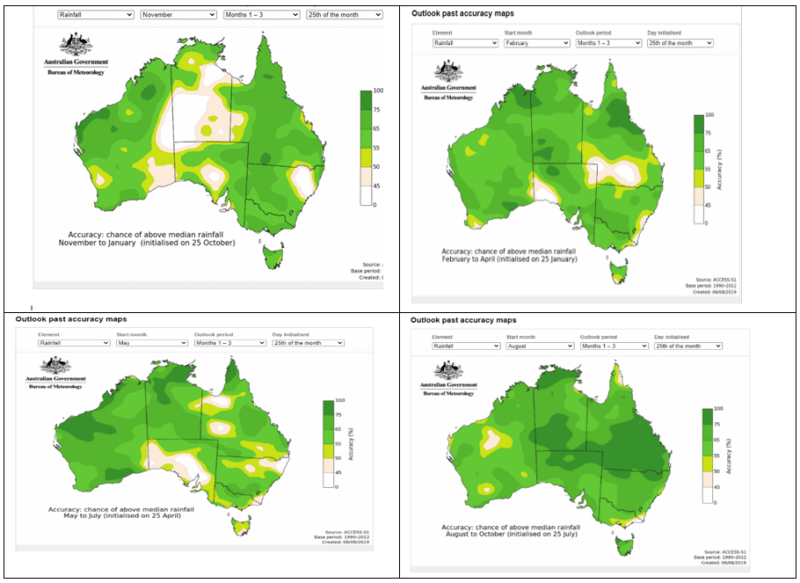
Figure 2. Past accuracy (darker green higher accuracy) for ACCESS S for summer, autumn, winter and spring.
The maps of past accuracy (Figure 2) indicate that autumn and spring forecasts on Eyre Peninsula are more reliable than summer and winter. Measuring skill with a simple statistical forecast such as the SOI is relatively simple compared to measuring skill with a dynamic forecast such as ACCESS -S. It is very expensive in terms of computing time to run the dynamic model and hence the hindcasts are a much smaller sample than the operational forecast. Furthermore, the observing systems in the oceans and atmosphere are improving all the time. Hence a model that uses the deep ocean will not be able to be initialised for the El Nino events in the 1980s.

Figure 3 is a comparison of the 8 years since dynamic models were first used in 2013. Comparing the map of the forecast and map of actual deciles enables a comparison as hit (forecast for increase chance of dry and region was dry) and misses. It also shows cases where rainfall across the region was patchy.
Unfortunately for the launch of the dynamic models, 2013 was an emphatically wet forecast for spring and the season was very dry. However, from 2014 to 2020 there has been useful guidance to SE Australia and EP. For SE Australia there were hits in the 2014-2015 El Nino. In 2015 the El Nino was especially harsh in the region around Horsham. The 2014 season could be counted as a mild failure to warn on EP as the forecast was neutral 50% chance of poor season and the season was dry. A severe “failure to warn” is when the forecast is for wet and the season is very dry (like 2013 or the winter of 2020). This is worse than a ‘false alarm’ especially if the wider region is dry and the local area was average.
The IOD negative of 2016 was an emphatic wet forecast that was followed by a wet spring. In 2017 the drier outlook was matched by a dry or neutral spring in EP and SE Australia and the very dry outlook in 2018 was followed dry conditions in SE Australia and neutral to dry on EP. The climate drivers of ENSO and IOD were neutral in 2017 and 2018, however the subtropical ridge was unusually strong over winter and spring. In 2017 the Southern Annular Mode (SAM) was in a positive phase; in 2018 a higher than normal number of high-pressure systems formed over the Tasman Sea. In 2019, the IOD positive drove a dry forecast which occurred and the late developing La Nina in 2020 led to a wet October. For SE Australia of the 8 years there was one clear miss (2013), three OK (2014,2015 and 2017) and four hits (2016, 2018, 2019 and 2020). For EP there were two misses (2013,2014) three OK (2015, 2017 and 2018) and thee hits (2016, 2019 and 2020). Farmers in Upper EP will protest at 2020 being a hit, but most will acknowledge that the October rain just came too late.
The experience of 2020 (content mainly from 2020 EP Farming Systems book article)
At the start of the season, SARDI Climate Applications, along with many agronomists and farmers and most climate scientists expected 2020 to be wet. We were surprised by the dry winter but relieved that a late developing La Niña brought rain in October which helped most, but not all, regions.
Table 1. Rainfall in mm and decile using a base period from 1900 to 2020 for eight focus paddocks used in the Resilient EP project. Above median deciles (deciles 6 to 10) are shown in bold. Data from Silo Data Base as patched point data.
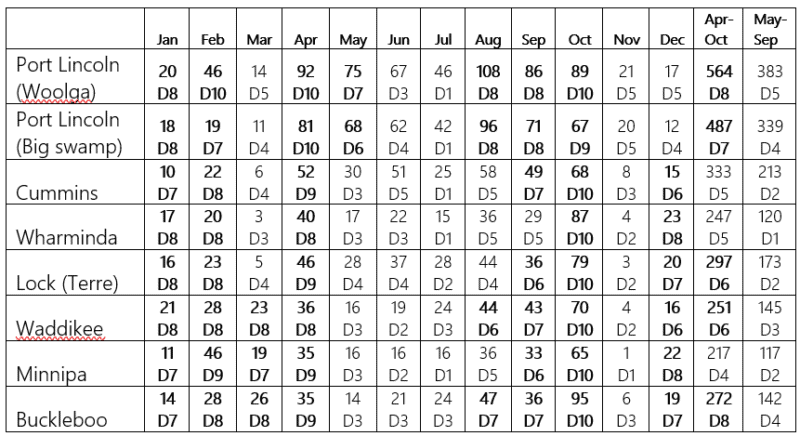
Table 1 shows the contrast of the very dry May, June and July with the preceding months. August was mixed, September was generally wetter than median while October was very wet. The wet October boosted later crops and districts but interfered with harvest for the earliest crops. November was very dry (Minnipa 1mm, Lock 3mm) with December rain above decile 5 at most sites.
Farmers and agronomists that were following seasonal climate science had invested time to understand that a negative IOD and La Niña was encouraging. They also understood that there were many climate models and sources of information and that when all the models were pointing to the same outcome that this increased confidence. The strong forecast for wet conditions was followed by an extremely dry May to July. Perhaps the month that seemed to be the biggest failure of the forecast was July. This is in part because July is the wettest month and partly because on many paddocks the wet April provided moisture to buffer the early crop growth across May and June.
There has been increasing media discussion and GRDC funded communication on the impact of climate drivers such as ENSO and the Indian Ocean Dipole on winter growing season rainfall in Southern Australia. Sites such as https://forecasts4profit.com.au/ show that these climate drivers swing the odds and are best represented as probabilistic forecasts. For example, a La Niña is best understood as increasing the likelihood of wetter deciles and decreasing the likelihood of dry deciles rather than the easier to follow statement that it will be wet. There is a strong tendency for media to simplify the message to a negative IOD will lead to wet conditions. This simple causal thinking is easier to understand and more natural for most of us. In contrast, probabilistic thinking is harder work. An El Nino in 2015, the subtropical ridge and SAM in 2017 and 2018 and the IOD negative in 2019 supported causal thinking. The media coverage of 2020 was framed around a bounce back to a good year after the widespread drought and bushfires that ended 2019.
The positive outlook for the 2020 season started with summer rainfall and widespread April rainfall, but this was bolstered by discussion on climate drivers for the 2020 growing season. This is captured in an ABC article from 18th April titled “Wet winter likely as speculation over La Niña and a negative IOD mounts”. The article cites a Bureau of Meteorology spokesperson “I think it’s a little better than rumours now, which feels like a good thing to say,” “There are really strong odds, probably the strongest we’ve seen since 2016.” “Looking at other models from around the world, it’s amazing they are all saying a very similar thing and I’ve probably looked at half a dozen or more of the top models now,” “They are all suggesting that the odds are increased of having some good rainfall over the next few months for much of Australia.” The ABC article continued “The outlook suggests there is an above 60 per cent chance of above-median rainfall for most of the country for at least the next three months.”
The emphatically wet outlook for winter was followed by an actual emphatically dry winter which had an impact on crop growth and level of trust in the forecast.
Blame the dry winter on an unusual cyclone and positive SAM
The oceans were strongly primed for a negative IOD and this was picked up by all six international climate models reviewed by the Bureau of Meteorology. The time series of the IOD index (Figure 4) starts with the negative IOD associated with the wet spring of 2016 and shows how the strongly positive IOD from 2019 dropped to a weakly negative IOD over March to May in 2020. The encouraging signs of a fall of the IOD and warming of waters to the NW of WA surprisingly swung to a positive IOD in June and July.
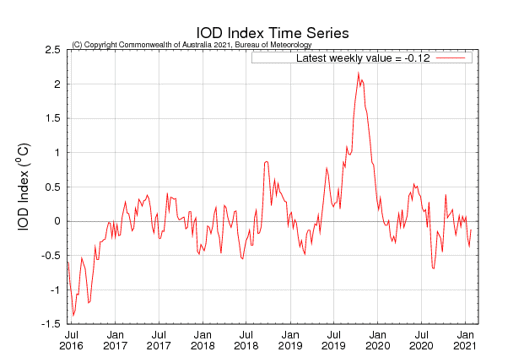
Figure 4. Time series of the Indian Ocean Dipole from Bureau of Meteorology website (http://www.bom.gov.au/climate/enso/indices.shtml?bookmark=iod).
One explanation for the abrupt change in the IOD in July was tropical Cyclone Mangga which was not only unusually late (19-23 May), but followed an unusually southward track. There were wild storms, flooding and power cuts across WA including Perth and a cooling of a section of the SE tropical Indian Ocean to the NW of Australia which reversed the trend in the IOD. A further complicating factor was the rapid development towards a positive Southern Annular Mode (SAM) which contributes to drier conditions in southern Australia in winter.
A general pattern for 2020 was the forecast for the month after next to be wet, and then to see the forecast switch to neutral or dry. For example, the forecast in May was emphatically for a wet July but by June the forecast for July had switched to neutral or dry. This was because the model was picking up the influence of the cooling of the ocean from cyclone Mangga and the development of the positive SAM. SAM events can only be forecast about 2 weeks ahead and the genesis of cyclones less than 2 weeks. According to the Bureau of Meteorology, large swings in the seasonal outlook as seen in 2020 are unusual. The key drivers of our climate, which rely on patterns of ocean temperatures such as IOD and ENSO, typically change slowly and users are more used to a shift from neutral to wetter or drier but not a swing from wet to dry. Obviously checking the latest forecast is important, but this can be frustrating as many agricultural decisions require a longer-term outlook such as the decision to plant a riskier crop such as canola or taking a more optimistic view on top-dressing nitrogen.
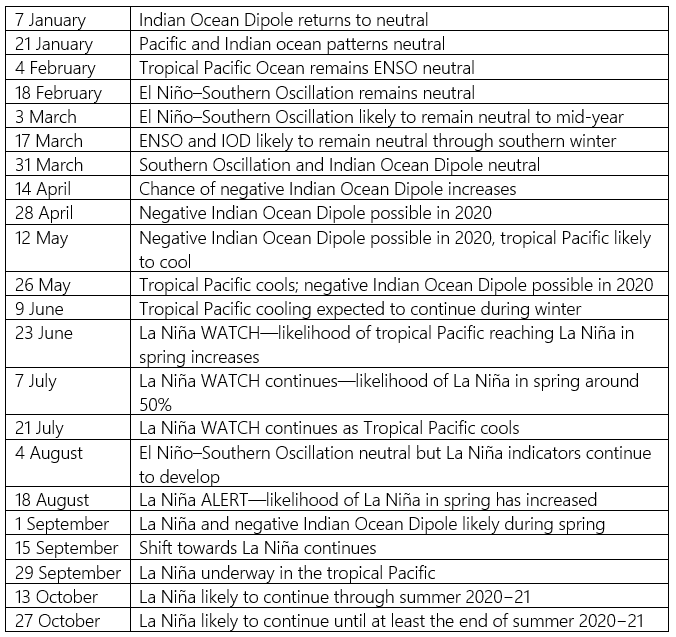
The late developing La Niña led to a slowly building confidence of wet conditions. As shown in the headlines from climate driver updates (Table 3), the Bureau of Meteorology issued a La Niña watch on 23 June followed by La Niña alert on 18 August and declared a La Niña under way on 29 September. To the relief of most farmers and all climate forecasters, the emphatic forecast for a wet October was followed by an October that was emphatically wet.
Table 2 Headlines from Bureau of Meteorology Climate Drivers Update http://www.bom.gov.au/climate/enso/ through 2020.
What does this mean for communicators and users of climate forecasts?
- Remember that the skill of the forecast increases from a low base through the winter growing season.
The skill of seasonal climate forecasts comes from the main climate drivers of ENSO and IOD which haven’t settled into a neutral, positive or negative phase until later in the growing season. Graeme Anderson (Ag Vic) has the useful analogy of following a football team where there is a lot of pre-season speculation which starts to firm up as the season progresses. The consistency of models in April and May suggesting increased odds of a wetter than average growing season tended to over-shadow the point that all models have low skill at this time of the year and that models can be consistently wrong.
- Because dynamic seasonal forecasts are influenced by new developments in the ocean and atmosphere during the season, we need to check the latest update.
The reason why the skill of the forecast is low in autumn is because patterns in the ocean and atmosphere evolve over the season. These processes move at different time scales and 2020 is an example where a weather event (cyclone Mangga off the NW coast of WA) and a rapid shift in SAM played a major role. The Bureau of Meteorology are issuing more forecasts (weeks, fortnights, months and seasons) which are updated more often. It is obviously an advantage for forecasts to be updated with the latest information, but this can be a challenge for users. GRDC has funded the monthly Break newsletter from Ag Victoria to comment on South Australian conditions (https://grdc.com.au/news-and-media/newsletters/fast-break/south-australia). This is useful for updates as it provides clear explanations with a summary of models.
- Appreciating that even 80% chance of above median rainfall includes 20% chance of the opposite happening.
Seasonal climate forecasts from the Bureau of Meteorology are rarely more emphatic than 80% chance of exceeding the median rainfall. As quoted from the ABC article from 18th April 2020, most of Australia had above 60% chance of exceeding median rainfall but some parts of the map had up to 80% chance. Although a high number, 80% leaves a 1 in 5 chance of drier than median rainfall. This chance of the minority outcome is nowhere near the level used in most agricultural experiments (95%) which is 1 in 20 chance of the result being due to chance. Most AgVet chemicals set a much higher level (99% or 1 in 100) of the treatment working and in human health we are used to chances of 1 in 1000 and in aviation safety 1 in 10 Million. The 80% chance is more like a professional golfer missing a five-foot putt (compared to 99.4% for three feet, 91.4% for four feet and 60% for six feet). This is also about the chance of a penalty shoot-out in professional soccer (83%). Watching a professional golfer or penalty shoot-out is interesting because it is uncertain. Even if we know the statistics it remains uncertain and interesting. We don’t say “because there is more than 80% chance the result is guaranteed and I won’t bother watching” rather, if we care about the results, we think about the two possible outcomes even though one is much more likely than the other.