Making use of yield data for more informed nitrogen decisions
A new SAGIT funded project is underway on the Eyre Peninsula to develop a machine-learning framework for variable-rate nitrogen applications.
Project AGM_01426 (2026–2028) combines EM38 soil mapping, gamma radiometrics, satellite imagery, historical yield and protein maps, and SILO climate records to build paddock-specific nitrogen prescriptions for dry, average and wet season scenarios. Rather than relying on the model alone, each prescription is tested against replicated on-farm strip trials.
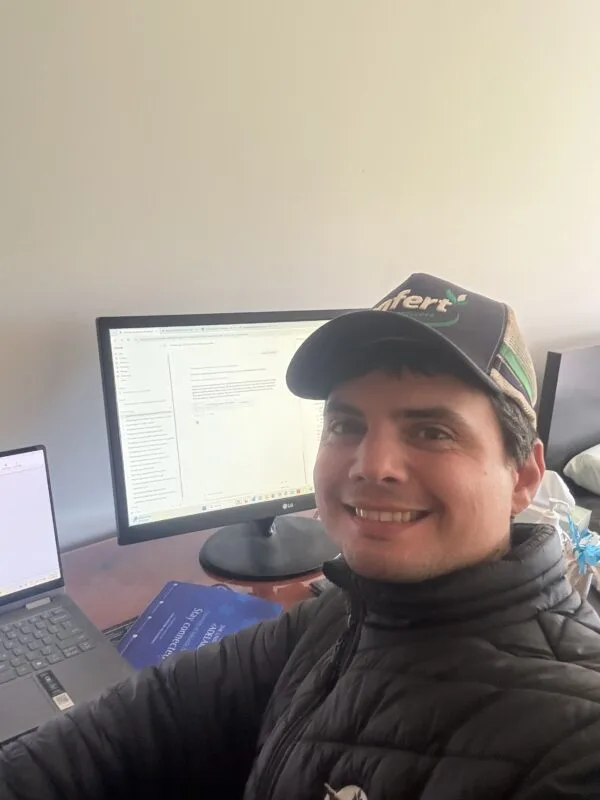
Above: Fabio Arsego, AgSave Kimba working on the project.
In 2026, trials were established on three commercial host paddocks in the Cleve, Kimba and Buckleboo districts, covering wheat and barley on the shallow calcareous soils typical of the Upper Eyre Peninsula. Each site includes nil and stepped nitrogen rate strips laid over the growers’ own programs, using their existing spreader and sprayer controllers. This means the trials reflect real farm operations rather than small-plot conditions.
The exceptionally wet 2026 season has provided a valuable calibration point for the wet end of the project’s scenario range, which is often the hardest data to capture in the Eyre Peninsula environment. The season has also produced some findings of direct grower interest, including a clear biomass response to deep ripping on a sandy site. Harvest results from the three sites will help show how well the model’s zones and nitrogen rates have performed.
The work was presented at the Australasian Precision Ag Symposium in Sydney in early September, and SAGIT has also put the project forward for the GRDC Updates in Adelaide in February 2027.
A grower guide has also been developed for those who are just starting their precision agriculture journey. The guide steps through retrieving yield data from the header using an SD card or USB, opening the data in SMS, and checking the raw yield map before doing anything further with it. The free version of SMS can be used to open proprietary data and visualise raw yield maps.
With harvest approaching, the guide is a timely resource for growers looking to make better use of the yield data already being collected on-farm.
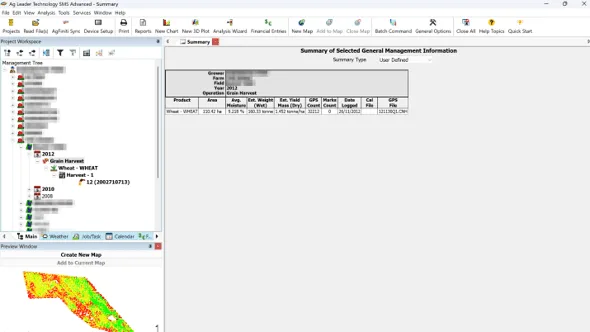
Image: Example of harvest operations with yield data – expanding a field shows a Grain Harvest entry. Selecting it brings up the harvest summary (area, moisture, tonnes, yield) and a coloured yield map preview at bottom left.
Access the grower guide below, or on the AIR EP “Tools and Resources” page under “Farming Systems”.
Unlocking Your Header Data – A Growers Guide
Thankyou to Fabio Arsego from AgSave Kimba for providing the information about this trial.