RiskWi$e: Some tools to examine the historical odds of the autumn break
Peter Hayman and Dane Thomas, SARDI Climate Applications 5 June 2025
Most farmers and their advisers are focussed on this season and will have limited interest in long term records. Nevertheless, some have asked how this season differs from the long term record and whether breaks are getting later.
Defining the autumn break using rainfall
There is no standard definition of the break of season, but a common definition is 25 mm in 3 days used by Pook et al. (2010) for Victoria and Smith (2021) for NSW. Some other commonly used definitions are 20 mm in 7 days used in some Agricultural Production System sIMulator (APSIM) modelling (Fletcher et al. 2020, Nidumolu et al. 2025). After consulting grain growers in southern cropping regions in 2021, the Bureau of Meteorology included 15 mm in 3 days and 25 mm in 3 days as part of the Forewarned is Forearmed suite of products available on their Climate Outlook website Overview—Summary - Climate Outlooks
Historically, the autumn break was primarily an opportunity for weed germination. As more options for in-crop weed control became available, the break became the start of sowing activity. Now, with dry sowing becoming widespread in South Australia, the break represents the date of crop germination. These changes in farming practices revise meaningful definitions of the break of season. The amount of rain required for germination and emergence of a dry sown crop is less than what was previously required as an opportunity to sow a crop or knockdown weeds and then sow a crop. After a long wait to the end of May in 2024, dry sown crops in SA emerged with less than 10 mm on light textured soils. This is a credit to the operational skill of growers with managing their farming system including setting up their sowing equipment and knowing their paddocks. Some paddocks with heavier soils did not respond to the end of May rain in 2024, which highlights the need for a range of rules depending on soil type.
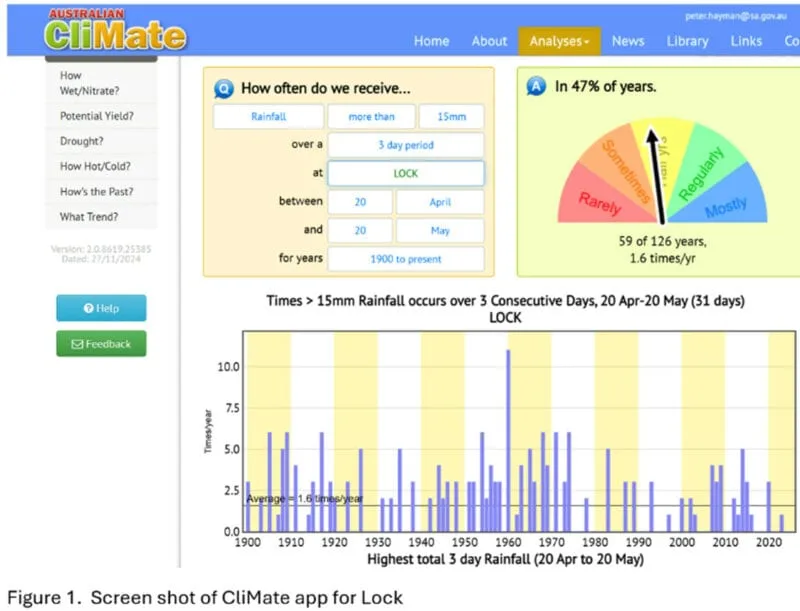
Using the CliMate app
Search for “CliMate App” to find an easy way to check how often a location has received X mm of rain over Y days (Figure 1). Both the amount of rain and the number of days can be adjusted by the user. The user can also set the dates and the historical period. Figure 1 shows that if we use the long-term record, a grower at Lock can expect 15 mm in 3 days between 20 April and 20 May about half the time. The CliMate App is based on feedback from many growers and advisers. It is well designed and can be used to answer most climate related questions.
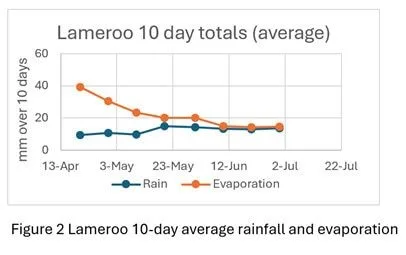
Considering evaporation as well as rainfall
From late April to June, the average rainfall increases and evaporation decreases (Figure 2.) The drop in evaporation is typically greater than the increase in rainfall. Figure 2 shows that at Lameroo, the average 10-day rainfall increases from about 9mm in the later half of April to about 15mm in mid-May to the end of June. Over the same period, the 10-day evaporation decreases from about 40mm to 15mm. The year-to-year variability in evaporation for any 10- day period is relatively minor compared to the enormous range in rainfall experienced from year-to-year. One way of measuring the range is to divide the difference between decile 9 and decile 1 by decile 5. Using long term records for the 10 days ending on 20 May at Lameroo, this value is 40% for evaporation and 300% for rainfall. The actual numbers will be different for other locations, but the much greater changes in evaporation compared to rainfall is likely to be similar.
A University of Adelaide crop scientist, Dr Murray Unkovich (2011) proposed a definition of the break of season as the 7-day rainfall exceeding 7-day evaporation. This allows for a lower rainfall threshold later in the season as evaporation falls. This rule has been used in published work on the break of season across southern and western grains region (Flohr et al 2021). The screen grab of the SARDI Climate Applications spreadsheet below compares six rules starting on 20 April (Figure 3).
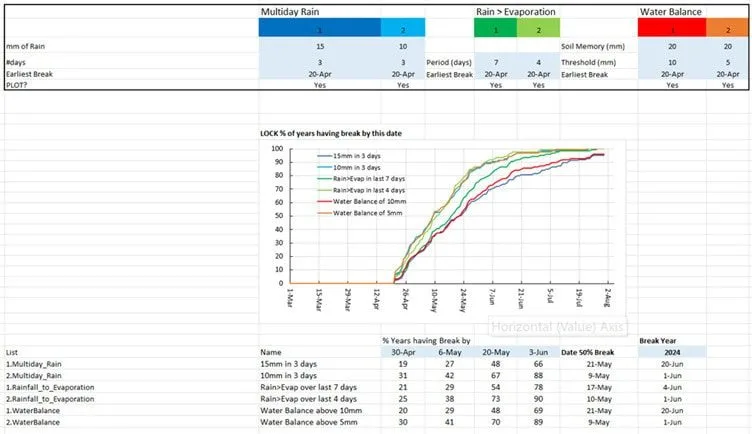
Figure 3 SARDI sowing rule calculator
The rule of 15 mm in 3 days shows the 50% likelihood by 21 May, which is close to what we find from CliMate. Reducing the rainfall requirement to 10 mm in 3 days brings the 50% chance forward to 9 May. We have included the rainfall exceeding evaporation rule but enabled the user to change the number of days. For a crop dry sown in a light textured soil, 5 days with rainfall above evaporation may be enough for germination. We have also included a simple water balance which subtracts daily evaporation from daily rainfall. This is like considering a 20 mm cup in the paddock which allows rainfall in and evaporation out, the evaporation is only counted if there is water in the cup to evaporate and we record the first day that there is 5 mm in the cup which might apply for germination in a light soil or 10 mm which might apply to a heavier soil.
In 2024, after a long wait growers received 7.5 mm on 31 May and 2 mm on 1 June, followed up with 11 mm over 14-15 June. Th e final column in the screen grab above shows that the rules that included evaporation identified the end of May or early June break in 2024. In this location, the rules using 15 mm or 10 mm in 3 days missed out.
Figure 4 shows the unsurprising result that the family of curves for a dry location like Minnipa are later (shifted to the right) and flatter than a wetter location like Cummins.
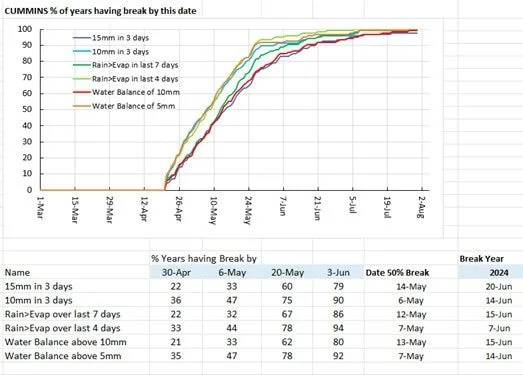
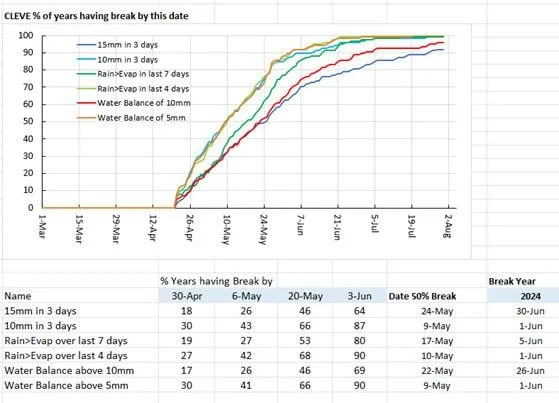
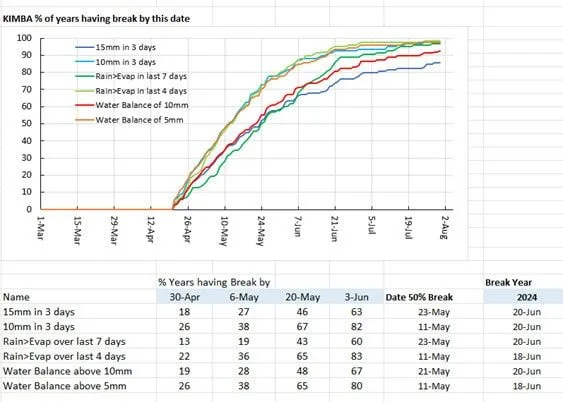
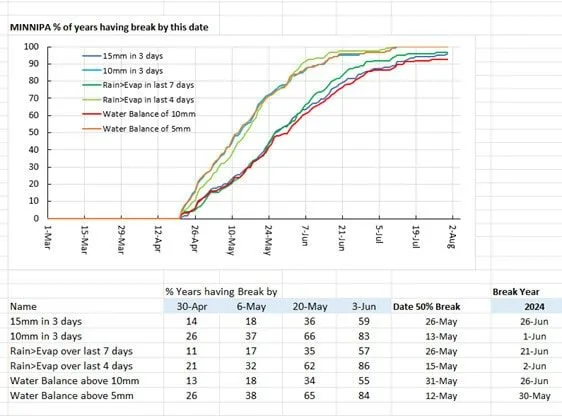
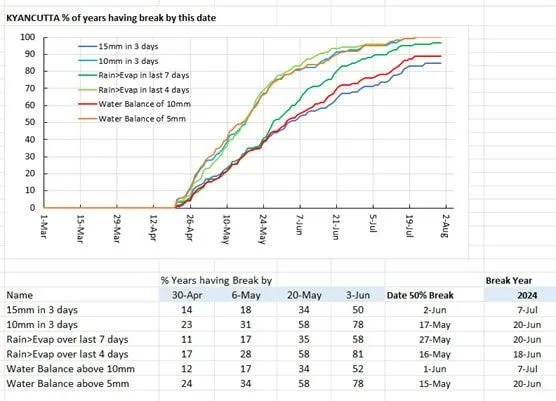
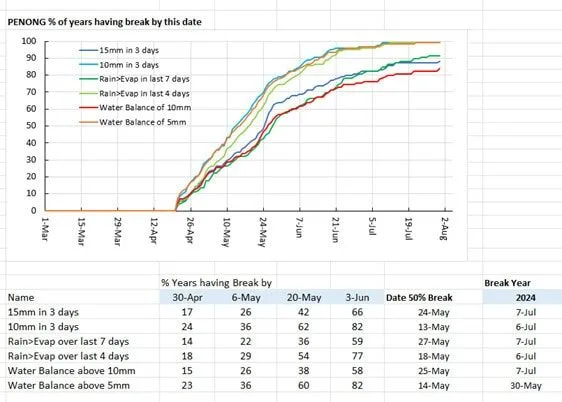
Figure 4. Cumulative probability of break of season for 6 rules at 6 sites
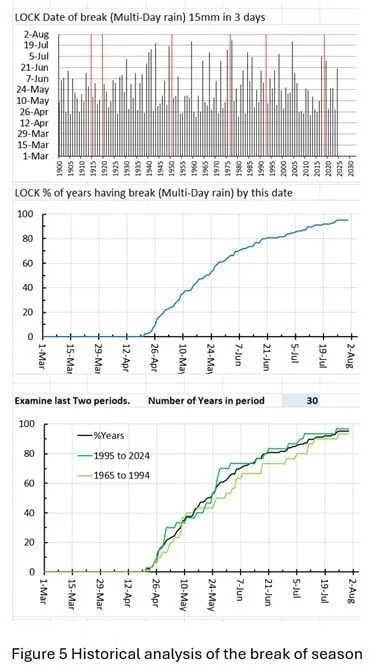
A common question is whether the break of season is getting later. The SARDI sowing rule spreadsheet includes a number of ways of looking at this for each of the six user-defined rules. The top graph in Figure 5 is a simple time series of the date of receiving 10 mm in 3 days at Lock. Using this rule, there was a bad run of late breaks in the late 1930s and there was good run in the early 2000s. There is no clear trend. The bottom graph compares the recent 30-year period 1995 to 2024 with the previous 30-year period 1965 to 1994. Using this rule, the curve for the latter period is slightly shifted to the right which suggests later breaks. Although there is a general trend towards drier conditions with higher evaporation, the shifts in the date of the break depends on the rule used and the periods being compared.
In this article, we reference the widely used CliMate App [ CliMate: Home Page ] and describe a SARDI Climate Applications spreadsheet designed for internal use by Dane Thomas. We are making a prototype version of the spreadsheet available for evaluation. The SARDI Climate Applications spreadsheet includes instructions on importing climate data for any location and adjusting a set of rules. This is supported as part of SARDI Climate Applications involvement in the Grains Research and Development Corporation (GRDC) funded RiskWi$e project and the Australian Government’s Future Drought Fund funded SA Drought Hub project. The spreadsheet is an applied research tool and is not as user friendly as the CliMate App. CliMate will address the majority of questions and is an excellent first step.
Please contact [email protected] or [email protected] for any queries including a request for the spreadsheet.
References
Fletcher, A.L., Chen, C., Ota, N., Lawes, R.A. and Oliver, Y.M., 2020. Has historic climate change affected the spatial distribution of water-limited wheat yield across Western Australia?. Climatic Change, 159(3), pp.347-364.
Flohr, B.M., Ouzman, J., McBeath, T.M., Rebetzke, G.J., Kirkegaard, J.A. and Llewellyn, R.S., 2021. Redefining the link between rainfall and crop establishment in dryland cropping systems. Agricultural Systems, 190, p.103105.
Nidumolu, U., Hayman, P., Fletcher, A., Ota, N., Round, V., Thomas, D., Chen, C., Cooper, B. and Ratcliff, C., 2025. Farming on the edge: assessing the impact of historical and future climate change on the mediterranean cropping margins of Australia. Climatic Change, 178(4), pp.1-25.
Pook, M, Lisson, S, Risbey, J, Ummenhofer, CC, McIntosh, P, Rebbeck, M., 2009. The autumn break for cropping in southeast Australia: trends, synoptic influences and impacts on wheat yield. International Journal of Climatology 29, 2012-2026.
Smith, A., 2021. The Autumn Break, fact or fiction. NSW Local Land Services The autumn break - fact or fiction? - Local Land Services
Unkovich, M., 2010. A simple, self-adjusting rule for identifying seasonal breaks for crop models. In 'Proceedings of the 15th ASA Conference 'Food Security from Sustainable 708 Agriculture'. Lincoln, New Zealand', 15-19 November 2010.
![]()