RiskWi$e: Yield potential as the season dries
By Andrew Ware, EPAG Research
Recent warm, dry weather is testing the large canopies built across Eyre Peninsula this season. The latest EP RiskWi$e focus paddock reports still indicate substantial water-limited yield potential, but the amount of accessible soil water and the crop’s progress through grain fill are becoming increasingly important to how much of that potential reaches the header.
At Lock, the modelled yield range has narrowed markedly as the season has progressed. The median has eased only slightly over the past week, while the prospect of a higher-yielding finish has reduced. The soil moisture probe provides a complementary picture: the crop is drawing on reserves through much of the monitored profile.
The focus paddocks on 24 September
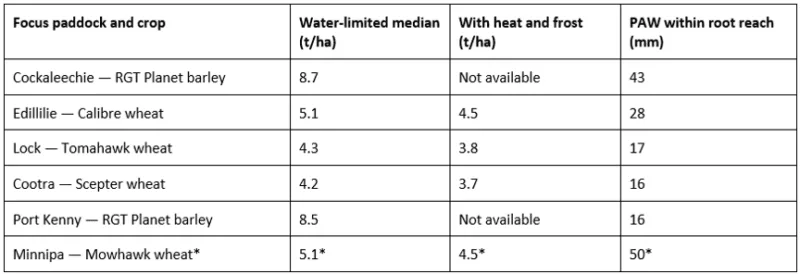
Yields are approximate readings of Yield Prophet Reports at 50% probability of exceedance, rounded to 0.1 t/ha. They are modelled potential, not measured yields or guaranteed harvest outcomes. PAW is plant available water from the accompanying crop report, using the best calibrated and matched soil in the APSoil database. This does not relate to soil probe measurement. The barley reports do not provide the heat/frost yield adjustment. *Minnipa uses Wedgetail as a substitute for Mowhawk; all its model outputs require caution.
Lock, Cootra and Port Kenny have only around 16–17 mm of modelled PAW within reach of roots. Edillilie has about 28 mm and Cockaleechie 43 mm. These figures help describe the remaining buffer, but cannot be interpreted independently of crop stage: a crop approaching maturity has less grain filling left to support than one only just flowering.
The two barley paddocks have high modelled potential and are further advanced than the wheat paddocks. Port Kenny’s narrow yield curve suggests relatively little remaining variation from historical finishes within the model. It does not rule out losses in grain weight, quality or yield from stresses the model does not capture.
Reading the probabilities
Yield Prophet combines the season to date with historical weather sequences for the remaining season. A yield at 50% probability of exceedance is the median: half the simulations exceed it and half fall below it. The curves are conditional on the model inputs and historical finishes, not a forecast assigning current weather-outlook probabilities. This update uses water-limited yield, with nitrogen assumed non-limiting, throughout.
Lock shows how expectations have changed
The sequence of Lock reports illustrates a useful RiskWi$e principle: updating a yield range is more informative than holding onto one early-season number. In June, a wide range of finishes remained possible. By late September, much more of the season is known and the opportunity for extra rainfall to lift yield has diminished.
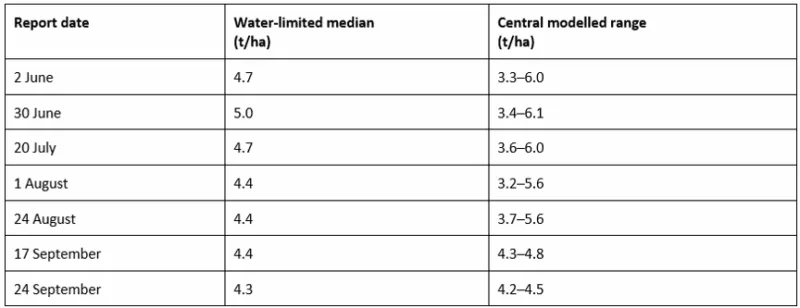
Approximate readings from the unadjusted water-limited curves. The central range spans the yields at 80% and 20% probability of exceedance, covering the central 60% of simulated outcomes. It is not the full possible range or a rainfall-decile forecast.
The latest change is therefore more about losing upside than a collapse in the median. Between 17 and 24 September, the median eased by roughly 0.1–0.2 t/ha, while the upper end of the central range fell from about 4.8 to 4.5 t/ha. The Yield Prophet reports alone cannot separate the effects of recent weather, normal seasonal progression and any changes to model inputs.
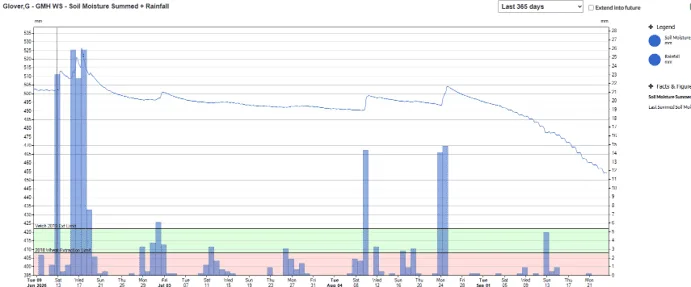
Figure 1. Lock Gold Mine Hill summed soil moisture and rainfall, captured on 24 September. The downward trend steepens through September despite small rainfall events.
The summed trace falls from approximately 504 mm after the late-August rain to around 454 mm on 24 September: a net decline of about 50 mm. This is a change in total probe-reported water storage, not 50 mm of crop transpiration or a direct measure of remaining plant available water.
Where is the crop finding moisture?
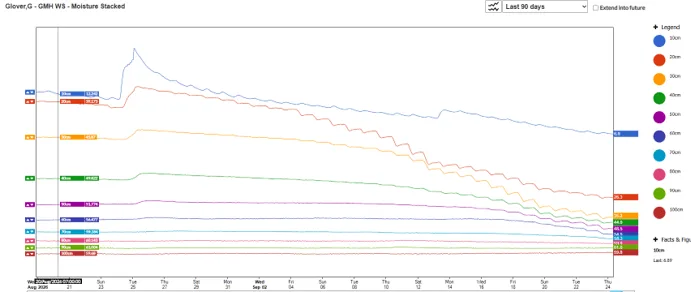
Figure 2. Lock Gold Mine Hill moisture traces at 10 cm intervals, 20 August to 24 September. Read changes within each trace; the stacked display offsets the depths vertically.
The depth traces show pronounced drawdown at 20–40 cm, with increasing depletion at 50–60 cm and a smaller decline around 70 cm. The 90–100 cm traces change little. This pattern is consistent with extraction extending through deeper layers as the upper profile dries; it does not demonstrate that all water below the active layers is available to the crop.
The small mid-September rainfall response is most evident near the surface and does not interrupt the broader drying trend. For these large canopies, the question is increasingly how much water the established root system can still extract, and how quickly that supply can meet grain-fill demand.
The summed probe reading remains about 46 mm above the displayed 2018 wheat extraction line, whereas Yield Prophet estimates 17 mm of PAW for Lock. These are different measures. The probe monitors to 1 m and uses a historical extraction reference; the model uses a selected soil profile, crop lower limits and an 0.8 m root depth. The difference is a reason to check calibration and rooting assumptions, rather than treat either number as a precise estimate of water still available across the paddock.
Minnipa needs a variety qualification
The Minnipa paddock is sown to Mowhawk, but the model is using Wedgetail because Mowhawk could not be selected. Mowhawk develops faster, so its actual flowering and grain-fill timing may be ahead of the simulation. The model’s 22 September flowering date and 24 November maturity date should therefore not be used as predictions for the crop in the paddock.
This mismatch affects the timing of water demand and exposure to heat and frost. Earlier development could reduce exposure to a hot, dry late finish, but may change exposure to earlier frost events. We cannot reliably adjust the yield upwards or downwards from the Yield Prophet reports alone. The Minnipa figures are best treated as a provisional model scenario until checked against observed crop stage and a more suitable phenology setting.
Warm dry air and grain filling
Days around 29–31°C, particularly with low humidity, can put pressure on crops still filling grain. Warmer conditions can shorten the filling period, leaving less time to accumulate grain weight. More intense heat can also disrupt grain filling directly. Smaller grains can reduce yield and increase screenings, although the response depends on crop stage, duration of exposure, variety and water supply.
Low humidity increases the drying demand of the air, known as vapour pressure deficit. Where roots can supply enough water, transpiration helps cool the canopy. As accessible moisture declines, stomatal closure can restrict both cooling and photosynthesis. Atmospheric demand can therefore rise even while a water-stressed crop’s actual water use falls. This is particularly relevant to the large canopies and declining moisture reserves at several focus paddocks.
There is no single temperature at which all crops suffer the same loss. The reports’ mild heat category starts at 32°C, but that is a model threshold, not a guarantee of no stress below it. A forecast maximum alone cannot establish damage or justify a fixed yield deduction. Crops still actively filling grain have more yield exposed than those already at physiological maturity.
Recent frosts add a separate uncertainty
Mild frost events were reported across parts of EP around 17–18 September and again on 22 September. These may affect grain fill in susceptible areas, but the occurrence of frost does not establish the extent of crop damage. Crop stage and conditions within each part of the paddock matter.
The wheat Yield Prophet reports show heat/frost-adjusted water-limited medians around 0.5–0.6 t/ha below the unadjusted curves. These are combined modelled effects. The gap cannot be attributed specifically to the recent frost dates, and the adjustment should not be deducted a second time from the adjusted yield.
The Cootra crop report records four mild and two moderate frost events in its defined sensitive windows. That is a model weather-and-growth-stage signal, not a field assessment of damaged heads. Equally, a report showing no events does not rule out damage in a colder part of the paddock. Yield prophet currently doesn’t have a heat/ frost risk damage function for barley so the Cockaleechie and Port Kenny reports should not be interpreted as heat/ frost-free outcomes.
GRDC guidance indicates damage is often clearest 7–10 days after a suspected frost. Assessment of the 17–18 and 22 September events should allow for this delay. Checking susceptible low areas alongside higher ground, and revisiting tagged heads to see whether grain development continues, will help distinguish a cold event from a material yield loss.
What this means as harvest approaches
The focus paddocks still carry considerable potential, but there is less room for the finish to compensate for dwindling accessible water. Continued warm, dry conditions would place more pressure on the remaining grain fill, particularly where root-zone reserves are low. Timely rain and milder temperatures could support grain filling where the crop is still responsive; they cannot reverse grain already lost to frost or restore yield components that have already been set.
Comparing the modelled range with remaining soil moisture, observed crop stage and continuing grain development will help growers and advisors update harvest expectations as the finish unfolds.