RiskWi$e: Yield potential update August 2024
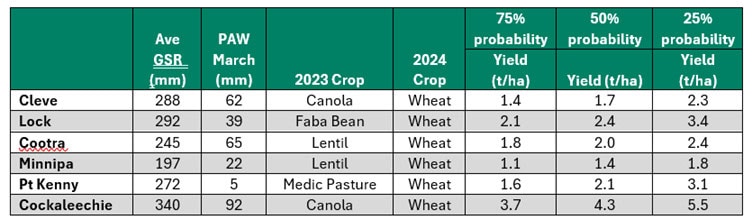
Yield Prophet uses historical climate information to simulate the range of yields possible for a given location and soil type. As the season progresses closer to harvest the range of possible outcomes narrows, however as Table 1 shows there are still gaps of 0.6 t/ha to 1.8 t/ha, depending on location, between the best and worst 25% of historical outcomes. This still presents a large level of uncertainty in terms of the yields that may be achieved this season and highlights that there is a lot that can change between now and harvest.
Table 1. Yield Prophet yield predictions for six Eyre Peninsula locations
Given that the growing season is over halfway through now, the impact that the weather we have had over the past few months has already played a large role in determining this year’s result. The combination of a later than optimal break to the season coupled with decile 1 growing season rainfall has had a significant impact on yield potential.
Table 2. Yield potential as simulated by Yield Prophet at four different timings throughout the season. The first timing shows a hypothetical 1 May break.
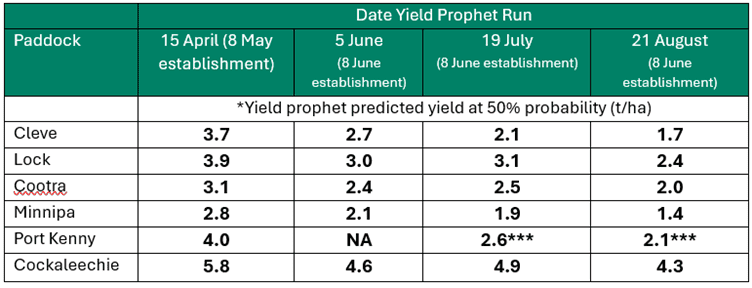
*Yield predictions above as displayed by Yield Prophet. Yields are water limited yield inclusive of the effects of heat and frost.
*** Port Kenny July and August simulations sown 15 June.
What do the numbers above tell us?
- The difference that a hypothetical early May establishment compared to the actual early June establishment resulted in a 25% yield decrease in simulated yields.
- From June to July, yield predictions remained steady as June/July rainfall was average to slightly above for most districts.
- Minimal rainfall in the first half of August has resulted in a decrease of around 0.5 t/ha in yield potential. This follows the logic that a lack of 20-30 mm rainfall (half a month) decreases yield accordingly.
- A dry start to August means the probability of receiving average rainfall for the month has severely decreased.
- Yield Prophet yield predictions show the dry conditions coupled with the rapid proximity to warmer weather means that there is approximately only a 10% chance to obtain average yields across the six paddocks being monitored.
- Good levels of stored soil moisture captured from November/ December 2023 rainfall have helped buffer damage to date from the dry conditions, but with plant roots currently extracting moisture from below 60 cm, these reserves are rapidly running out.
Yield Prophet and how to understand it

The Yield Prophet graph above gives us a snapshot of what could potentially occur given a range of seasonal outcomes. 1% probability places the season at the wettest in 100 years and 100% places the season at the driest. The tables on the page prior use 25 (above average), 50% (median) and 75% (below average) probability to display a sound range of outcomes.
Cleve focus site, prepared 21 August 2024
Table 3. Cleve focus paddock information.
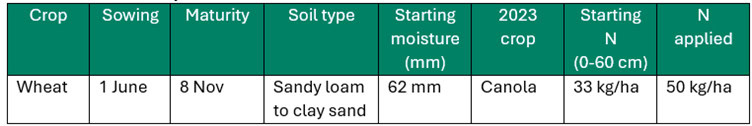
The focus paddock at Cleve is a reliable paddock with a soil type that has a relatively large bucket size. This is particularly evident in the section of the paddock where yield predictions are formulated.
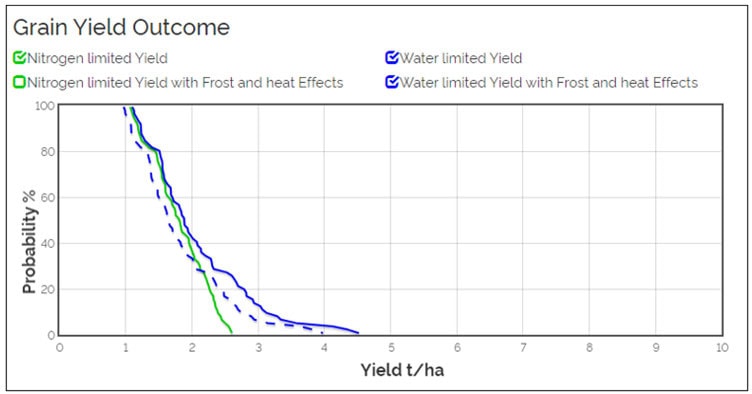
Figure 1: Yield Prophet graph from Cleve, generated on 21 August 2024. Green line indicates the predicted nitrogen limited yield and blue line indicates the water limited yield. The dotted blue line represents water limited yield potential with frost and heat effects. This is based on the assumption that yield is only limited by these factors and no others (ie pests, weeds, diseases).
Cockaleechie focus site, prepared 21 August 2024
Table 4. Cockaleechie focus paddock information.
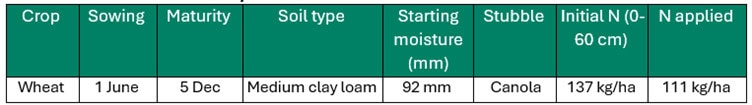
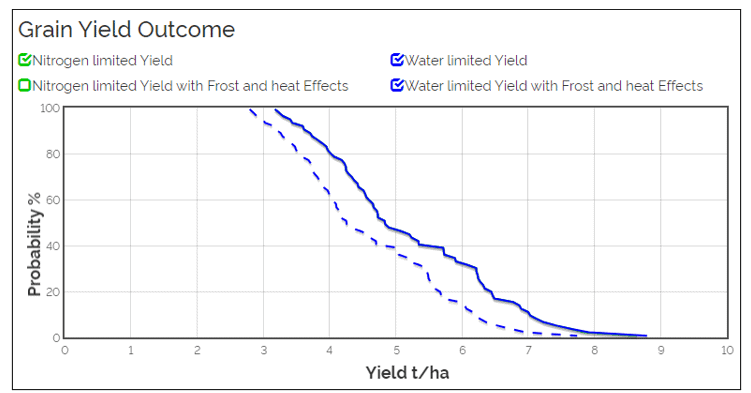
Figure 2: Yield Prophet graph from Cockaleechie, generated on 21 August 2024. Green line indicates the predicted nitrogen limited yield and blue line indicates the water limited yield. The dotted blue line represents water limited yield potential with frost and heat effects. This is based on the assumption that yield is only limited by these factors and no others (ie pests, weeds, diseases).
Cootra focus site, prepared 21 August 2024
Table 5. Cootra focus paddock information.
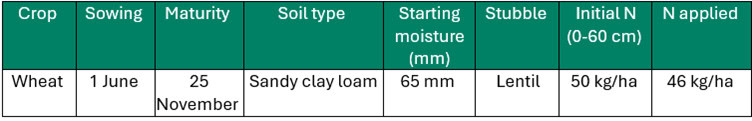
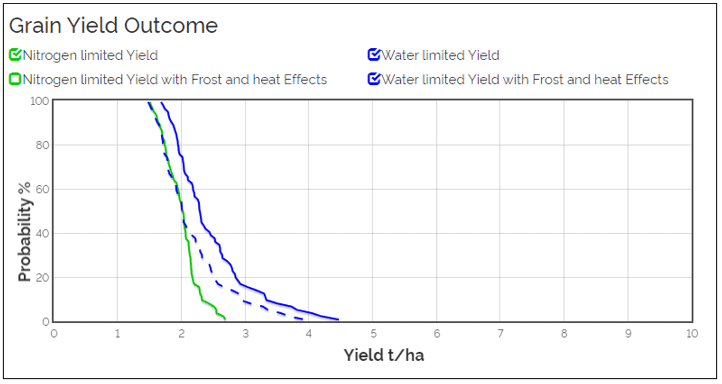
Figure 3: Yield Prophet graph from Cootra, generated on 21 August 2024. Green line indicates the predicted nitrogen limited yield and blue line indicates the water limited yield. The dotted blue line represents water limited yield potential with frost and heat effects. This is based on the assumption that yield is only limited by these factors and no others (ie pests, weeds, diseases).
Lock focus site, prepared 21 August 2024
Table 6. Lock focus paddock information.
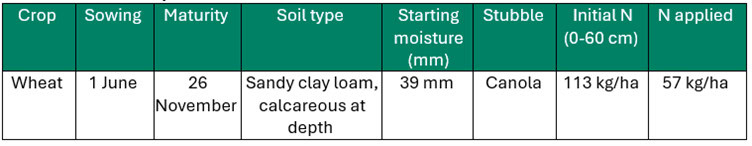
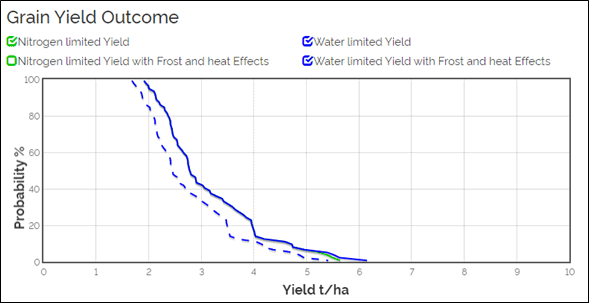
Figure 4: Yield Prophet graph from Lock, generated on 21 August 2024. Green line indicates the predicted nitrogen limited yield and blue line indicates the water limited yield. The dotted blue line represents water limited yield potential with frost and heat effects. This is based on the assumption that yield is only limited by these factors and no others (ie pests, weeds, diseases).
Minnipa focus site, prepared 21 August 2024
Table 7. Minnipa focus paddock information.
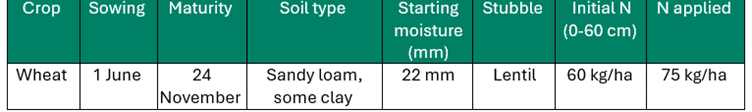
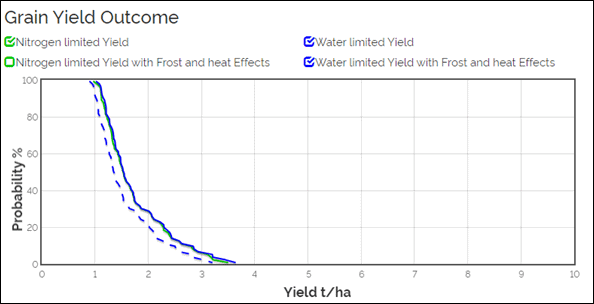
Figure 5: Yield Prophet graph from Minnipa, generated on 21 August 2024. Green line indicates the predicted nitrogen limited yield and blue line indicates the water limited yield. The dotted blue line represents water limited yield potential with frost and heat effects. This is based on the assumption that yield is only limited by these factors and no others (ie pests, weeds, diseases).
Pt Kenny focus site, prepared 21 August 2024
Table 8. Port Kenny focus paddock information.
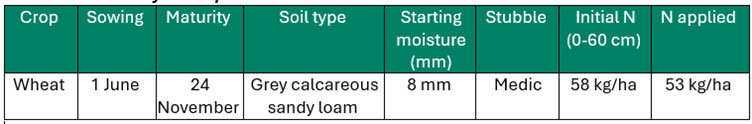
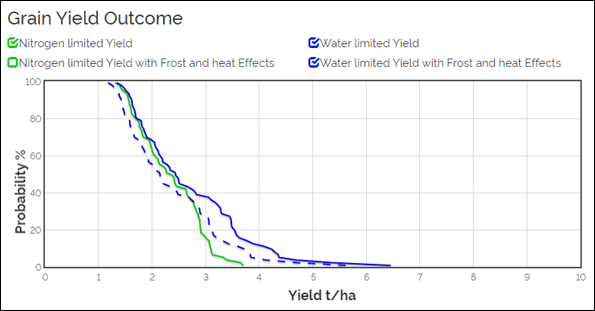
Figure 6: Yield Prophet graph from Pt Kenny, generated on 21 August 2024. Green line indicates the predicted nitrogen limited yield and blue line indicates the water limited yield. The dotted blue line represents water limited yield potential with frost and heat effects. This is based on the assumption that yield is only limited by these factors and no others (ie pests, weeds, diseases).
If you require any further information or would like to discuss yield outlooks please contact Jacob Giles, EPAG Research, Port Lincoln, 0431 110 018 or jacob@epagresearch.com.au.
To access crop reports for the 6 EP focus sites in the project, go to: https://airep.com.au/research/riskwise-national-risk-management-initiative-action-research-groups-eyre-peninsula/