Working through tricky decisions
The following report has been generated by Cummins farmer Will Long using AI, to support his decision making about investing in soil amelioration, particularly in light of current concerns around fuel availability and pricing. The report incorporates Will’s own production data, along with a range of assumptions about key variables, to help inform this decision-making process. This article might be best viewed on the computer with a cuppa, lots of info!
Soil Amelioration Investment Analysis
Decision report for farm owners and internal decision makers
Based on mapped treatment areas and the operating assumptions discussed in this planning process
Headline conclusion: at current assumptions, the project is economically attractive if the true long-run yield response is at least ~15%. At ~20% response it is highly robust. At ~10% response it becomes fragile and can fail. The real decision is therefore not ‘diesel or no diesel’ but ‘how confident are we that these soils are constrained enough to produce a durable ≥15–20% uplift?’
1. Scope and decision question
This report consolidates the operational facts, cost build-up, base-case returns, downside analysis, and probabilistic Monte Carlo work completed after the treatment areas were mapped. It is written to help owners compare two stories:
- Status quo story: avoid the upfront spend, accept current soil limitations, and continue carrying the existing production profile and volatility.
- Amelioration story: accept a front-loaded capital hit, but potentially lift production and resilience for roughly seven years if the soil constraint is real and the job is executed well.
The key decision is urgency versus confidence. High diesel prices matter, but they are not the main driver of value. Yield response size and duration dominate the economics.
2. Mapped treatment areas
| Treatment zone | Area (ha) |
| Clay spreading zone | 7.99 |
| Bulldozer ripping zone | 66.95 |
| Total treated area | 74.94 |
Interpretation: only a small portion of the area requires clay spreading. Most hectares are in the cheaper bulldozer-rip / speed-till / spade pathway. That is important because the clay zone is the expensive, more transformative part of the program, while the larger dozer zone carries the economics of the whole project.
3. Operating assumptions and workflow
- Clay spreading: contractor at $400/hr plus fuel, 60 L/hr, productivity 0.5 ha/hr.
- Clay-zone ripping after clay spreading: owner tractor, 70 L/hr, productivity 3 ha/hr.
- Bulldozer deep ripping: contractor at $300/hr plus fuel, 100 L/hr, productivity 0.8 ha/hr.
- Speed till on dozer-treated area: two passes, hire fee $15/ha/pass, 70 L/hr, productivity 9 ha/hr.
- Spading across all treated hectares: 36 L/hr, productivity 2.2 ha/hr.
4. Machine hours and fuel burn
| Operation | Area basis | Machine hours | Fuel burn (L) |
| Clay spreading | 7.99 ha | 15.98 | 959 |
| Clay-zone ripping | 7.99 ha | 2.66 | 186 |
| Bulldozer ripping | 66.95 ha | 83.69 | 8,369 |
| Speed till x2 | 66.95 ha | 14.88 | 1,041 |
| Spading | 74.94 ha | 34.06 | 1,226 |
| Total | 74.94 ha | 151.27 | 11,782 |
Operational observation: bulldozer ripping dominates fuel use and time. Roughly seventy percent of all diesel burned sits in the dozer pass. That means diesel spikes do move the budget, but they still do not move it nearly as much as the realised yield response.
5. Total cost build-up and fuel sensitivity
| Operation | $1.60/L | $2.50/L | $3.00/L | Comments |
| Clay spreading | $7,926 | $8,789 | $9,268 | Highest $/ha on the clay zone; contractor + diesel intensive. |
| Clay-zone ripping | $298 | $466 | $559 | Small absolute cost, but required to complete clay pathway. |
| Bulldozer ripping | $38,496 | $46,028 | $50,212 | Main cost and fuel driver of the whole program. |
| Speed till x2 | $3,675 | $4,612 | $5,133 | Moderate spend; hire fee plus diesel. |
| Spading | $1,962 | $3,066 | $3,679 | Fuel-only cash cost in this model. |
| Total | $52,357 | $62,961 | $68,852 | Whole-project total. |
| Fuel price | Whole project $/ha | Clay zone $/ha | Dozer zone $/ha | Total project cost |
| $1.60/L | $699 | $1,056 | $656 | $52,357 |
| $2.50/L | $840 | $1,199 | $797 | $62,961 |
| $3.00/L | $919 | $1,279 | $876 | $68,852 |
At current high diesel (about $2.50/L), the modelled whole-project average cost is $840/ha, or about $62,961 across 74.94 ha. If diesel fell back to $1.60/L, the budget drops by about $141/ha. Useful, but not decisive.
6. Base-case returns under average conditions
Revenue assumptions used in the average-case analysis:
| Crop | Baseline yield | Price | Baseline revenue | 20% uplift value | |
| Canola | 2.5 t/ha | $650/t | $1,625/ha | $325/ha/yr | |
| Wheat | 4.0 t/ha | $330/t | $1,320/ha | $264/ha/yr | |
| Beans | 2.0 t/ha | $450/t | $900/ha | $180/ha/yr | |
| Metric | Average-case outcome at $2.50/L diesel | ||||
| Whole-project investment cost | $840/ha | ||||
| Annual hurdle over 7 years | $120/ha/yr | ||||
| Average annual uplift (20% response across rotation) | $256/ha/yr | ||||
| 7-year undiscounted extra gross revenue | $1,794/ha | ||||
| 7-year net gain after upfront cost | $954/ha | ||||
| Discounted NPV at 8% | $494/ha | ||||
| Simple payback | 3.3 years | ||||
Average-case reading: under the original 20% response assumption, the project adds roughly $256/ha/year of gross revenue, versus an annualised hurdle of only $120/ha/year. On paper, that is a healthy gap. The whole question is whether the true response really sits near 20%.
7. Breakeven analysis and fragility thresholds
| Crop | Base yield assumption | Price | Extra yield needed each year | Required uplift | ||
| Canola | 2.5 t/ha | $650/t | 0.18 t/ha | 7.4% | ||
| Wheat | 4.0 t/ha | $330/t | 0.36 t/ha | 9.1% | ||
| Beans | 2.0 t/ha | $450/t | 0.27 t/ha | 13.3% | ||
| Crop | Base yield needed at mid price to cover annual hurdle (20% response) | Base yield needed at low price to cover annual hurdle (20% response) | ||||
| Canola | 0.92 t/ha | 1.09 t/ha | ||||
| Wheat | 1.82 t/ha | 2.14 t/ha | ||||
| Beans | 1.33 t/ha | 2.00 t/ha | ||||
This table is useful because it shows where the economics break in a single year. Beans are the most fragile leg of the rotation. At weak bean prices, you need about 2.0 t/ha baseline beans before a 20% response covers the annual hurdle. Wheat is much more forgiving. Canola sits in between.
8. Status quo story versus amelioration story
| Dimension | Status quo story | Amelioration story |
| Cash flow | No large upfront spend. Short-term cash preserved. | Large upfront spend now. First-year accounting optics can look ugly if season is poor. |
| Yield profile | Carry current soil limitations and current production ceiling. | Potentially lift yields and gross revenue for ~7 years if response is real. |
| Volatility | Stay exposed to current downside in constrained sands. | Potential to improve resilience, but benefits only show if seasons and execution cooperate. |
| Decision risk | Risk of doing nothing and leaving value in the paddock. | Risk of spending capital on a response that proves smaller or shorter-lived than hoped. |
| Owner psychology | Feels safer because no big cheque is written. | Feels worse in year one if conditions are dry, even when long-run NPV is positive. |
For owners, the practical difference is this: the status quo avoids pain now but likely locks in constrained productivity. The amelioration path introduces immediate cost and execution risk, but opens a seven-year window of potentially higher revenue and improved paddock performance. Urgency should therefore be governed by confidence in response and confidence in executing the job well, not by diesel alone.
9. Monte Carlo analysis: why it was needed
The deterministic average-case model is useful, but agriculture does not occur at average yields and average prices every year. To test fragility, the project was simulated repeatedly using random combinations of crop, yield, price and response.
- Yield ranges used: canola 1.2–3.5 t/ha, wheat 2.8–7.0 t/ha, beans 1.0–3.5 t/ha.
- Price ranges used: canola $550–800/t, wheat $280–420/t, beans $300–750/t.
- Investment horizon: 7 years.
- Discount rate: 8%.
- Response levels tested: 10%, 12%, 15%, 18% and 20%, with annual variation around each response level.
Two paths were examined: an average-season path, and a stressed path where year one is forced to be a poor canola season (1.5 t/ha at $650/t) before normal randomness resumes.
10. Monte Carlo results under average seasonal path
| True average response | Mean NPV ($/ha) | Probability of loss | 10th percentile NPV | 90th percentile NPV |
| 10% | $-62 | 69.1% | $-227 | $111 |
| 12% | $93 | 28.9% | $-106 | $301 |
| 15% | $327 | 4.1% | $78 | $586 |
| 18% | $560 | 0.4% | $263 | $871 |
| 20% | $716 | 0.1% | $385 | $1,063 |
11. Monte Carlo results with poor first-year canola season
| True average response | Mean NPV ($/ha) | Probability of loss | 10th percentile NPV | 90th percentile NPV |
| 10% | $-111 | 82.5% | $-260 | $45 |
| 12% | $35 | 41.9% | $-143 | $222 |
| 15% | $255 | 6.9% | $32 | $488 |
| 18% | $475 | 0.7% | $206 | $756 |
| 20% | $620 | 0.1% | $322 | $932 |
The poor-first-year arithmetic is sobering: a 1.5 t/ha canola crop at $650/t only gives about $195/ha of uplift value at a 20% response in year one, against an upfront investment of about $840/ha. That is why the project can feel wrong in the short term even when the seven-year economics still work.
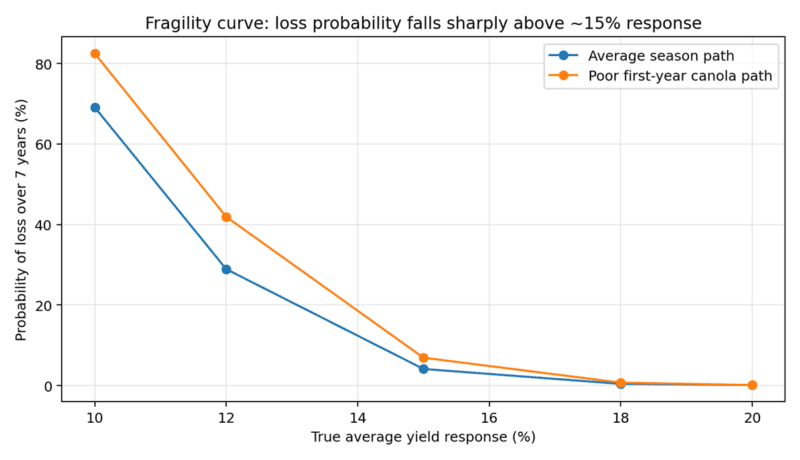
Figure 1. Loss probability falls sharply once the true long-run response moves above roughly 15%.
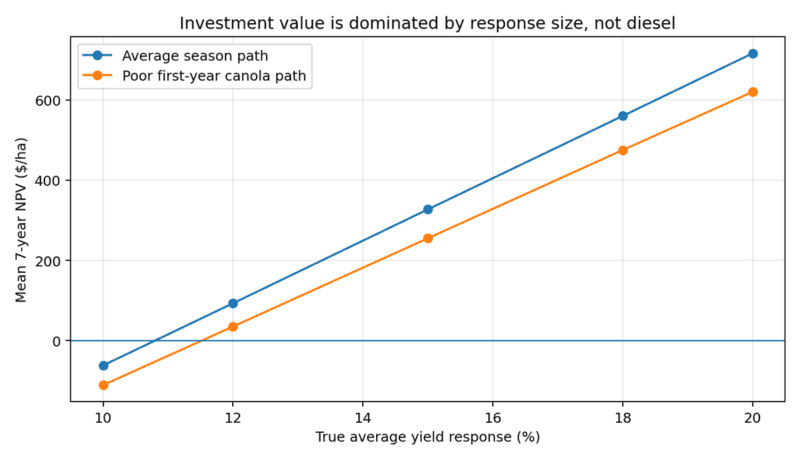
Figure 2. Mean NPV is dominated by response size. A poor first year hurts, but does not kill a genuinely strong response case.
12. Black hat analysis: what stack of conditions makes this fail?
A Charlie Munger-style inversion asks not ‘why might this work?’ but ‘what would have to be true for this to fail?’ The answer is not a single bad variable. Failure usually requires a stack:
- The true yield response is only around 10–12%, not 15–20%.
- The first year is poor, which makes the year-one return look deeply negative.
- Crop mix leans toward beans or weaker-value outcomes rather than stronger wheat/canola years.
- Prices are toward the bottom of their ranges at the same time as yields are weak.
- Execution is imperfect: poor clay distribution, inadequate ripping depth, poor soil mixing, or areas treated that were not constrained enough to respond.
- The response fades sooner than seven years, or is never fully realised because seasonal conditions prevent expression of the benefit.
In plain language: diesel alone does not break the project. The project breaks when modest response, poor season, weak price, and weaker crop-value years arrive together.
13. What the results say
The probabilistic work changes the framing of the decision:
- At 10% response, the project is fragile. Under average seasonal randomness, it loses money about 69% of the time. With a poor first year, that rises to about 83%.
- At 12% response, the project is no longer a disaster but is still uncomfortable. Loss probability remains material.
- At 15% response, the economics become acceptable. Loss probability collapses to about 4% under average conditions and ~7% even with a poor first year.
- At 18–20% response, the investment becomes robust. The project can withstand a poor opening year and still remain strongly positive on a seven-year NPV basis.
This is the critical takeaway for owners: the investment is not mainly a bet on diesel. It is a bet on whether the targeted hectares are constrained enough to deliver a durable response above roughly 15%.
14. Do it now, or wait?
Waiting for cheaper diesel saves about $141/ha in this model. But in a normal response case, delaying one year gives up about $256/ha of annual uplift value. So waiting only makes sense if management genuinely believes one or more of the following are true:
- The current season is likely to be poor enough that a year-one result will be very weak and that short-term cash-flow/psychology matters more than NPV.
- Fuel will fall materially and the response is not urgent to capture this year.
- Confidence in response is not yet high enough and more diagnostic work is needed before committing capital.
If confidence in response is already high, earlier implementation still tends to win on long-run value. If confidence is mixed, a staged rollout is more rational than an all-or-nothing decision.
15. Practical decision framework for owners
- Green light now: proceed if the owners believe the treated hectares can reliably deliver ≥15–20% response and the business can carry a poor first year without losing conviction.
- Stage the program: proceed on the highest-confidence paddocks first if confidence is moderate, cash flow is tight, or the current season looks risky.
- Wait and learn: delay if management increasingly suspects the true response is only around 10–12%, or if execution readiness is not high enough to do the job properly.
Final owner-level summary: under average assumptions the project looks good. Under probabilistic testing it remains good if the true response is at least ~15%. Below that threshold the economics become fragile. Therefore, the most valuable next step is not arguing about diesel in isolation; it is increasing confidence that the targeted hectares are genuinely constrained and likely to respond.
The Carrot
If the response materialises as expected, the farm converts an investment of roughly:
~$63,000
into approximately:
~$130,000 of additional gross revenue
over the next seven years.
After costs, that equates to roughly:
~$65,000–$70,000 extra profit from the treated hectares
The Status Quo Story – Do Nothing
If the farm chooses not to undertake the amelioration program, the business avoids the immediate capital spend of approximately:
~$840/ha
~$63,000 total across 75 ha
Thanks to Will for allowing us to share his report, and keep an eye out for a podcast with Will on how he used AI to generate this report, and maybe other cool ways he is using AI to help on the farm.
![]()