RiskWi$e: High yield potential, expensive nitrogen — how hard should we push?
By Andrew Ware, EPAG Research
The 2026 season has started with genuine upside across much of Eyre Peninsula.
Summer and autumn rainfall have lifted stored soil moisture, the break arrived close to the ideal window in many areas, and warm early conditions have helped crops establish quickly. In a lot of paddocks, yield potential is now higher than many growers would have budgeted for at sowing.
That creates a good problem — but still a problem.
With urea prices high and availability difficult, nitrogen is too expensive to apply simply because the season looks promising. At the same time, crops with strong establishment, stored moisture and low nitrogen could easily run short if N plans are too conservative.
So, how should we think about nitrogen decisions in a year with high yield potential, high urea prices and longer-term forecasts that still carry risk?
Nitrogen decisions are often built around a target yield. In a season like 2026, where stored moisture is high but fertiliser prices and seasonal risk are also high, it is worth looking at the decision from a few angles.
What yield range is realistic from here?
How much nitrogen is already in the system?
What response is needed for the next application to pay?
And how exposed are we if the season finishes dry?
At $1,400/t, urea costs about $1.40/kg product. Every 100 kg/ha urea costs about $140/ha and supplies about 46 kg N/ha.
That means nitrogen decisions have real money attached to them. A 100 kg/ha urea decision needs to generate roughly 0.4 t/ha of extra grain at $350/t wheat to cover the fertiliser cost. A 200 kg/ha decision needs closer to 0.8 t/ha. A 300 kg/ha decision, where that sort of rate is being considered, needs about 1.2 t/ha of extra grain just to cover the urea cost.
Protein, hay value and carryover nitrogen can improve the economics. Poor recovery, a dry finish, frost, heat or soil constraints can quickly reduce them.
This is where diminishing returns matter. The first units of nitrogen applied to a deficient crop with good moisture often have a strong chance of paying. Later applications usually become less certain. In a high urea price year, the most profitable nitrogen rate may be well below the rate needed to chase maximum yield.
A tool to test the economics
SARDI and GRDC have developed a RiskWi$e nitrogen decision tool called Fast Graphs for Slow Thinking – Nitrogen.
It can be found here:
https://designer.spreadsheetweb.com/a/n-fgfst-v3
The tool is designed to help growers and advisers think about nitrogen in both a seasonal and economic sense. It allows users to test different nitrogen rates against grain price, urea price, starting soil N, expected mineralisation, water-limited yield and different seasonal decile outcomes.
Rather than focusing only on the yield the crop could achieve in a favourable finish, the tool shows how the economics of different nitrogen rates can change across dry, average and favourable seasonal outcomes. This helps put a value on the upside of applying more nitrogen, while also showing the downside if the season finishes below current potential.
That is useful in 2026 because many paddocks have high yield potential, but the finish is not guaranteed. The tool can help test whether the next 50, 100, 150 or 300 kg/ha urea is likely to pay, rather than assuming the highest yield target is automatically the most profitable target.
What are the focus paddocks showing?
The Yield Prophet focus paddocks are not district forecasts. They are specific paddock examples. But they are useful because they show how different the nitrogen decision can be depending on soil water, starting N and crop demand.
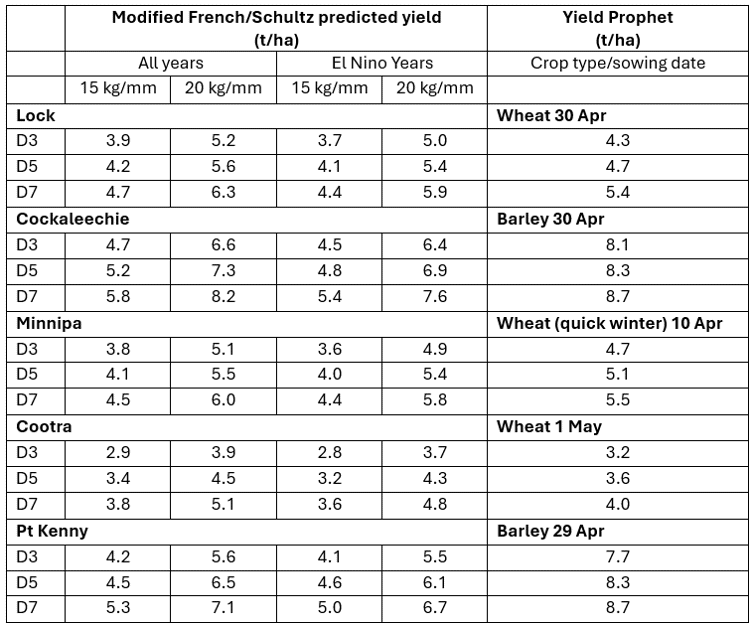
The table above brings together two different ways of estimating yield potential across a range of Eyre Peninsula focus paddocks.
The numbers should not be read as exact yield forecasts. They are better viewed as decision-support estimates that help show the range of possible yield outcomes under different seasonal finishes and assumptions about how efficiently crops convert water into grain.
The Modified French–Schultz estimates use starting plant available water, rainfall received between sowing and the current date, and future rainfall outcomes based on decile 3, 5 and 7 seasons. An evaporation/intercept value of 80 mm has been used, with water use efficiency set at either 15 kg grain/mm/ha or 20 kg grain/mm/ha.
The 15 kg/mm column provides a more conservative water-use estimate. This may be more relevant for paddocks with soil constraints, lower crop efficiency, weaker rooting depth, or where growers know from experience that the paddock does not convert water into grain particularly well.
The 20 kg/mm column shows what may be possible where crops are well established, soil constraints are lower, nutrition is adequate and seasonal conditions allow the crop to use water efficiently. It should be treated as an upside scenario rather than a guaranteed outcome.
The table also separates all years from El Niño years. This is useful because seasonal outlooks are pointing toward an increased chance of El Niño conditions developing. On Eyre Peninsula, El Niño years do not automatically mean poor yields, but they do generally increase the chance of a drier finish. Comparing the all-years and El Niño columns helps show how yield potential changes when the climate record is filtered toward those years.
The decile 3, 5 and 7 rows show different rainfall finishes from this point forward. A decile 3 outcome represents a drier finish, decile 5 is closer to a median finish, and decile 7 represents a more favourable finish. This is important because current stored moisture has created strong potential, but final yield will still depend heavily on rainfall, temperature, frost, heat and crop stress through the rest of the season.
The Yield Prophet column provides an independent paddock-specific estimate. Yield Prophet uses soil characteristics, starting water and nitrogen, crop details, sowing date, weather to date and long-term climate records to simulate likely yield outcomes from the current point in the season. These values are specific to the focus paddocks and should not be applied directly across whole districts, but they are useful for checking whether the simpler water-use calculations are in a realistic range.
Taken together, the table shows why nitrogen decisions this year are not straightforward. In many paddocks, current yield potential is well above average, particularly if the season finishes close to decile 5 or decile 7. However, the lower decile and El Niño columns show that there is still downside risk. The gap between conservative and optimistic yield estimates is the space where nitrogen economics need to be tested.
At Cockaleechie, the barley crop has high yield potential, strong stored water and a high current nitrogen supply. The report showed 128 mm total soil PAW, 183 kg/ha current N status and 155 kg/ha crop-available N. Yield Prophet suggested barley yield potential in the order of 8 t/ha plus. In this situation, the question is not whether the crop has upside — it clearly does — but whether more nitrogen is needed now, or whether the current N supply is enough to hold the crop until the next decision point.
At Minnipa, the wheat crop had very high stored water, with 147 mm total soil PAW, but a much lower current nitrogen position, with 57 kg/ha current N status and 52 kg/ha crop-available N. Yield Prophet suggested wheat yield potential around 5 t/ha, but the grain yield graph showed a clear gap between nitrogen-limited and water-limited yield. This is the classic high-water, low-N situation where under-fertilising could leave profitable yield behind.
At Lock, the wheat crop had 90 mm total soil PAW, 114 kg/ha current N status and 79 kg/ha crop-available N. Yield Prophet suggested wheat yield potential around 4–5 t/ha, but the paddock is on a grey calcareous loamy sand. That means the decision needs to account for both the water and the soil constraint. There may be upside, but it may not be sensible to assume high water use efficiency without checking paddock history.
At Cootra, the wheat crop had 95 mm total soil PAW, but only 34 kg/ha crop-available N at the time of the report, despite a higher projected mineralisation figure later in the season. Yield Prophet suggested wheat yield potential around 3–4 t/ha, with a large gap between nitrogen-limited and water-limited yield. This is a paddock where timing matters: if mineralisation does not meet crop demand quickly enough, the crop may become N-limited during the period when yield potential is being set.
At Port Kenny, the barley crop had 89 mm total soil PAW, 111 kg/ha current N status and 111 kg/ha crop-available N. Yield Prophet suggested high barley yield potential, but this is a grey calcareous sandy loam with a 600 mm rooting depth. In this environment, water use efficiency may be lower than the standard 15 kg/mm assumption. The decision is not just whether there is moisture in the profile, but whether the soil can convert that moisture and extra nitrogen into grain.
The message from these paddocks is not that one rate fits all. It is the opposite.
Some paddocks look like they need nitrogen to protect a high yield target. Others already have substantial N supply. Some have good water but known soil constraints. The best decision is paddock-specific.
When more nitrogen may make sense
More nitrogen is most likely to pay where the paddock has stored water, low available N, good establishment, a healthy crop and a history of responding to nitrogen.
In these situations, extra N is not just chasing upside. It may be protecting yield potential that already exists.
This is especially important where tools like Yield Prophet show a clear gap between nitrogen-limited yield and water-limited yield. That gap is the opportunity nitrogen is trying to capture.
When caution may be the better decision
Caution is warranted where soil nitrogen is already high, the paddock has a lower yield ceiling, water use efficiency is constrained, or the crop is unlikely to respond strongly enough to cover the cost.
At current prices, every nitrogen application needs to earn its place. If it does not produce extra grain, protein, hay value or useful carryover nitrogen, it can quickly reduce gross margin.
The risk is not that a particular urea rate is always wrong. The risk is applying it as a default without testing the likely return.
The take-home message
The 2026 season has created real opportunity. Many crops have good establishment, stored moisture and higher-than-average yield potential.
But urea at around $1,400/t means nitrogen decisions need to be tested, not assumed.
For some Lower EP paddocks, a large nitrogen application may be justified. For many Central, Eastern and Western EP paddocks, the better decision may be a smaller top-up, or waiting until the next rainfall and crop growth signals are clearer.
The best nitrogen decisions this year will come from asking whether the next kilogram of nitrogen is likely to pay across a range of possible finishes.
Protect the yield potential that is already realistic. Keep the upside alive where the paddock justifies it. But be careful about paying too much for the last tonne of grain before the season has earned it.
Check out the latest Yield Prophet reports for the RiskWi$e focus paddocks on the AIR EP website.
![]()